We deliver clear, financially meaningful technology insight fast. No long reports, no disconnected data. Just context, comparability, and confidence that move deals forward.
Compare internal controls against industry peers to identify structural weaknesses and advantages.
Cyber Threat Landscape
Assess vulnerabilities and exposure across governance, geography, and regulatory domains in one unified view.
Recommended Budget Changes
Visualize projected investment requirements over time based on identified risks and gaps.
Remediation Cost Snapshot
See projected one-time, annual, and staffing investments required to bring operations to target standards.
Top Action Items
Prioritize next steps for your company based on urgency, impact, value creation and deal risk.
Key Findings Summary
Review strengths, risks, and material observations surfaced during diligence.
Control Coverage Benchmark
Compare internal controls against industry peers to identify structural weaknesses and advantages.
Cyber Threat Landscape
Assess vulnerabilities and exposure across governance, geography, and regulatory domains in one unified view.
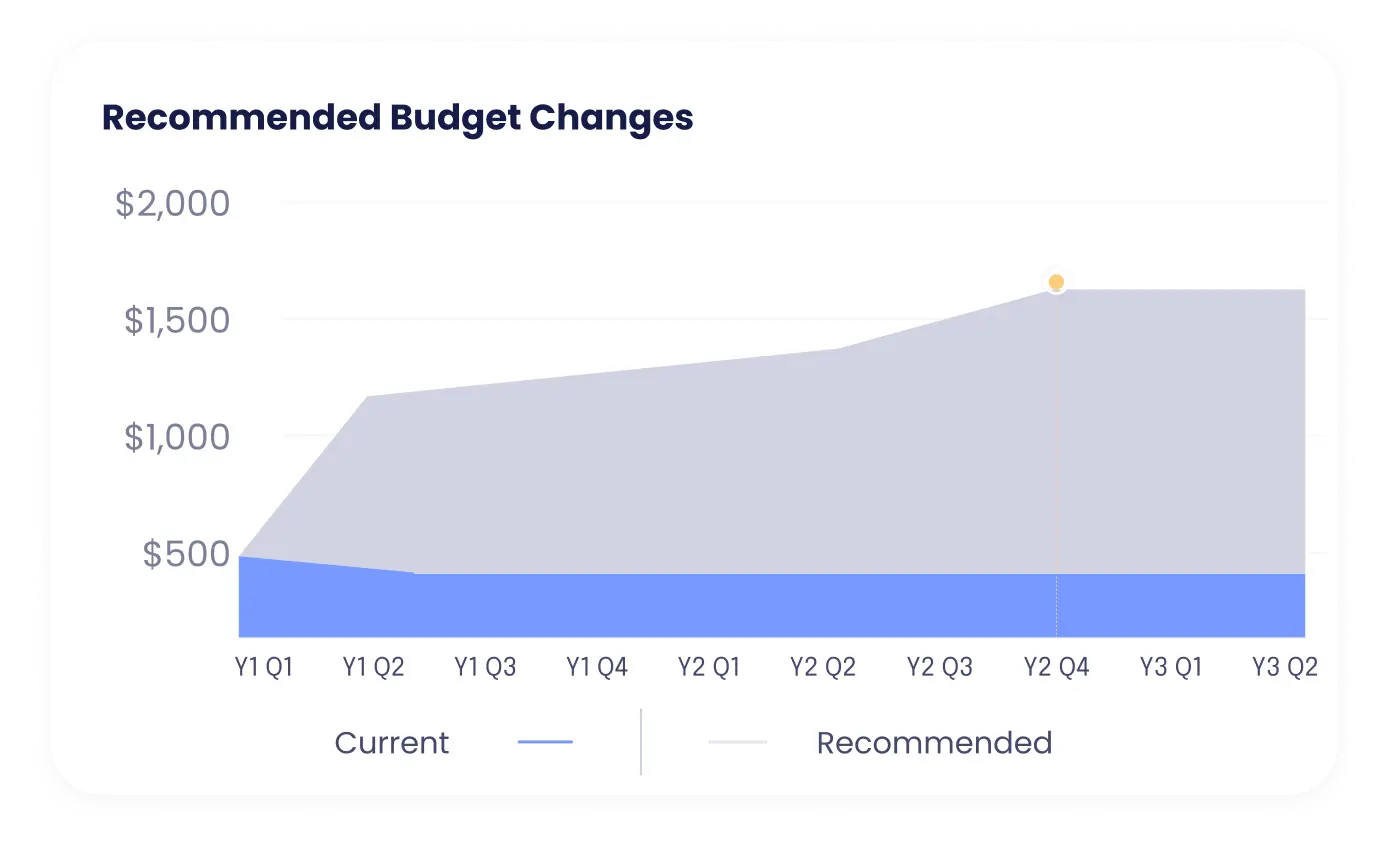
Recommended Budget Changes
Visualize projected investment requirements over time based on identified risks and gaps.
Remediation Cost Snapshot
See projected one-time, annual, and staffing investments required to bring operations to target standards.
Top Action Items
Prioritize next steps for your company based on urgency, impact, value creation and deal risk.
Key Findings Summary
Review strengths, risks, and material observations surfaced during diligence.
Benefits
How ACQUA Helps
ACQUA augments deal teams with automated efficiency, making technology value visible, comparable, and financially meaningful across the entire deal lifecycle.
Replace fragmented spreadsheets, inboxes, and status calls with a unified system that keeps diligence moving without friction.
Clear value levers for growth and margin
Surface the operational, financial, and technology drivers that directly impact upside and profitability.
Fast, comparable, IC-ready outputs
Deliver standardized, side-by-side analyses your investment committee can trust and act on immediately.
Buy-side clarity; sell-side credibility
Equip buyers with decision-grade insight while giving sellers defensible, well-documented positioning.
Speed without sacrificing confidence
Move faster through diligence without trading rigor, evidence, or accuracy for velocity.
Stronger outcomes from screening to exit
Improve returns by aligning early screening, execution, and value creation around one continuous intelligence layer.
INSIDE ACQUA
How to Get Started:
“You don’t need to change your stack to use ACQUA. Upload your diligence materials directly into the AI platform of your choice
From there, ACQUA structures everything against our proven framework, surfacing where value exists, where risk is concentrated, and how technology ultimately translates into return."
Thomas Davies
CEO — Abliminal
LEarn more
Try Our Free Version
Thank you! Check your email for a mesage.
Oops! Something went wrong while submitting the form.
Run technology due diligence reviews on any target. Bring your own AI – we provide the expertise.
.png)


.svg)

%201.webp)

%201.webp)


%201.webp)

%201.webp)

%201.webp)
.png)
.webp)

